A Look at Recession Indicators – 6 Aug 2024
With Friday’s soft jobs report and the subsequent selloff in stock markets, market pricing now implies over 150 basis points of cuts from the Federal Reserve over the coming year. The Fed would only cut rates that much if we see a significant slowdown in economic activity (I think a recession would result in larger rate cuts than that).
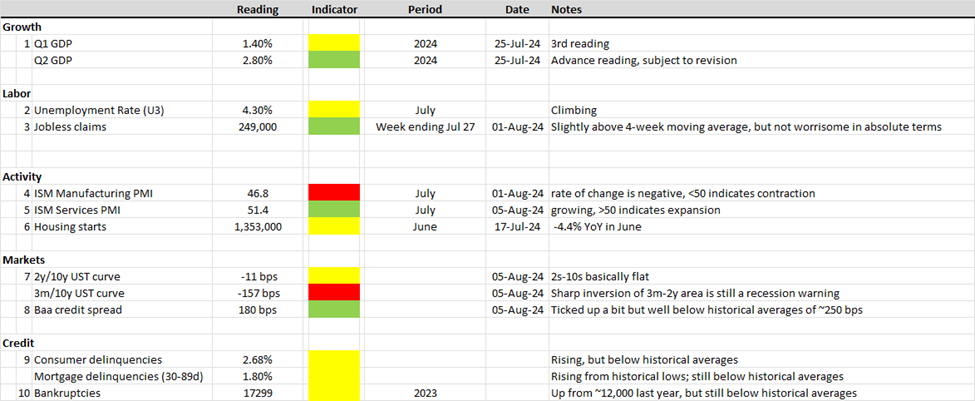
Before diving too much into thinking about what the Fed will do, I wanted to take stock of where ten recent economic and market data indicators have come in, and what the data tell us about the current state of the economy.
This note will conclude with my thoughts on Powell’s comments from last Wednesday, which obviously don’t reflect Friday’s payrolls print.
Growth Data
1. Real GDP
Doesn’t look like recession territory yet.
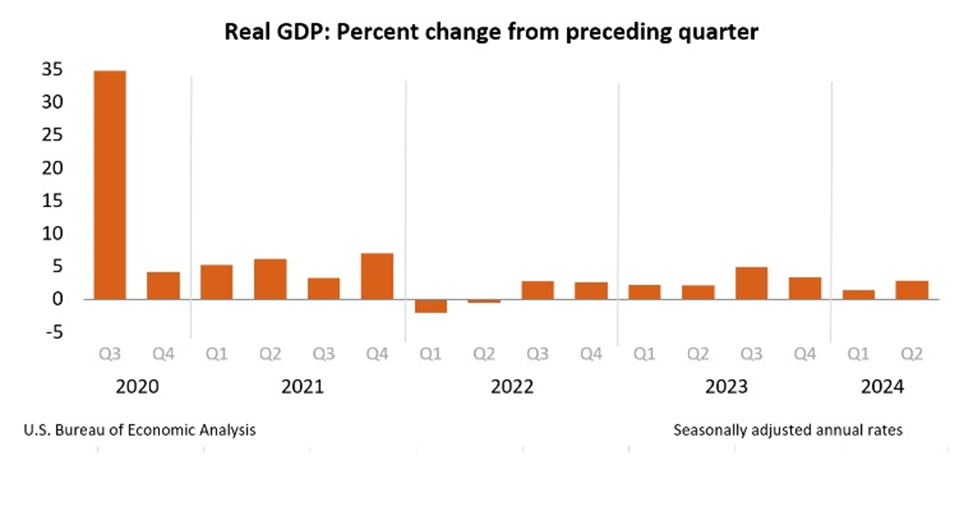
Although the final Q1 print was pretty bad at 1.4%, the advance number for Q2 looks pretty good at 2.8%. We’re already in Q3 though, so if things started to turn in July, it wouldn’t be reflected in the Q2 number.
Note the mini-recession we already had in 1H 2022 after Phase 1 of the tech bubble burst in November 2021. (Phase 2 of the bubble bursting is happening right now.)
Labor Market Data
2. Unemployment Rate (U3)
Ouch.
Although 4.3% unemployment is still a pretty good number by historical standards, I don’t think anyone feels good seeing this number continue to inch up. The non-farm payrolls increase of 114,000 for July also wasn’t great. This is the data release that really spooked the market, and investors (and the Fed) will be looking for confirmation of the trend suggested by this print.
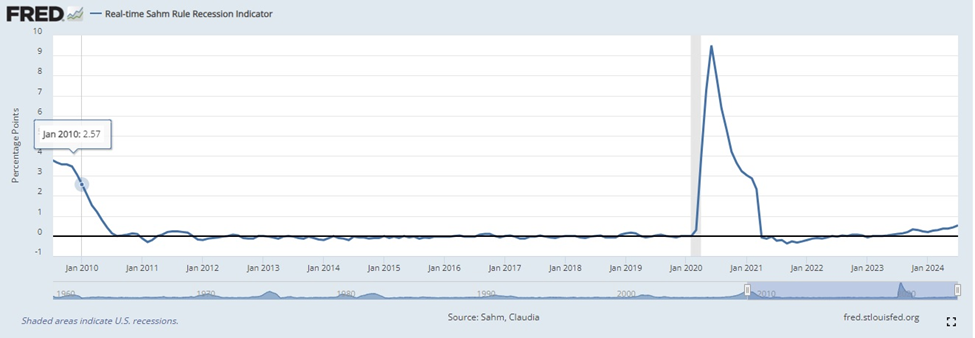
If you follow market news, you may have noticed something called the “Sahm Rule” getting talked about a lot. Basically, the Sahm Rule (it’s not a rule, it’s more of a trend indicator) says that when you get a sharp uptick in unemployment, it tends to be followed by bigger increases in unemployment. The threshold for the Sahm Rule was triggered with Friday’s data release. If the pattern holds, it would mean sharp increases in unemployment will be coming soon.
My general feeling is that the white-collar job market has been in “recession” for some time now. I feel like I know a lot of people who have been laid off. (Or it’s selection bias—people who have been laid off are told by their friends to come and talk to me.) Digging into this and prior data releases, we have seen consistent job growth in the healthcare and construction sectors, whereas the picture in information technology (mostly white-collar) is more murky.
I’ll have a deeper dive on labor markets next week.
3. Jobless Claims
Looks normal.
Jobless claims came in at 249,000, a slight uptick from the moving average of the prior four weeks. This is a pretty noisy data release, so people tend to look at moving averages for this (for example, a week with a holiday can make this number look a lot lower).
249,000 isn’t a bad number in absolute terms. I’d be much more worried if this was at, say, 350,000.
Business Activity Data
4. ISM Manufacturing PMI
Danger!
The ISM Manufacturing PMI came in at 46.8 in July, down from 48.5 in June, and should be viewed with serious concern. A number below 50 indicates contraction in the sector, and what we are seeing from June to July is acceleration of contraction.
Not good.
5. ISM Services PMI
Looks decent.
ISM’s Services PMI isn’t viewed with the same importance as the manufacturing survey, but I like to look at it anyway. July’s figure printed at 51, indicating a mild expansion. Importantly, it showed an improvement from June’s print, which was in contractionary territory.
6. Housing Starts
Shaky.
The Monthly New Residential Construction report showed new starts at 1,353,000 in June, and a decline of -4.4% year-on-year relative to 2023. My rule of thumb is that a figure below 1.5 million is cause for concern.
Single-family starts also declined month-over-month, from 1,002,000 to 980,000, which is not huge, but something to monitor. Nothing obvious jumped out at me from the regional breakdowns.
Market Data
7. UST Yield Curve
Still looks like a warning sign.
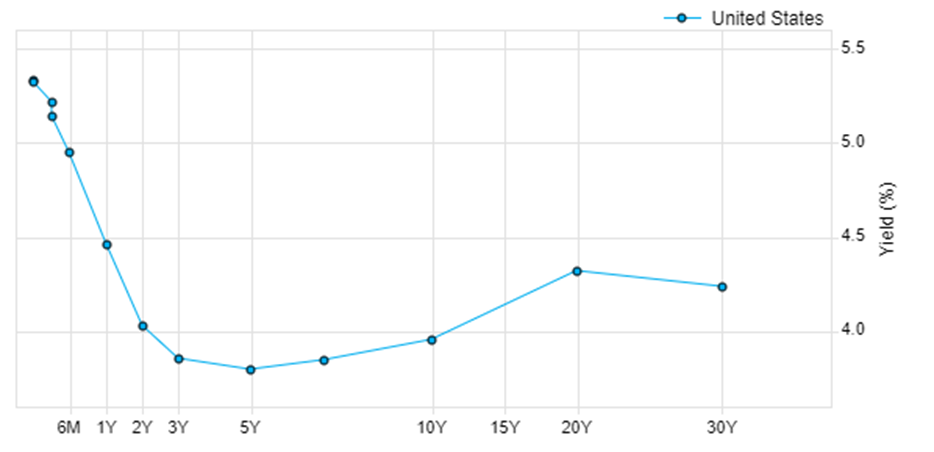
Source: FactSet
Although the 2y/10y curve is almost back to flat, 3m/10y is still steeply inverted (-157 bps). Clearly, that’s an indicator of sharp interest rate cuts over the intervening 21-month period.
8. Baa Credit Spread
Looks healthy.
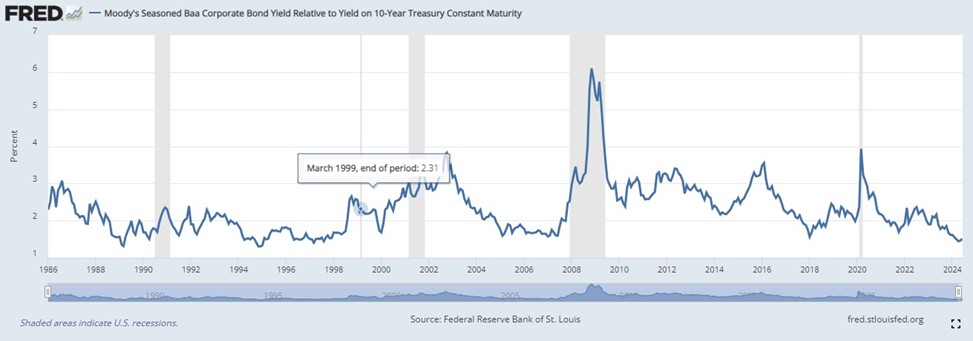
The spread between the Moody’s Baa Seasoned Corporate Bond and the 10y Constant Maturity UST is at 180 bps, which actually seems pretty tight to me. You can usually get Agency MBS at a nominal spread of 100 over 7y UST for no credit risk. The thing with credit spreads though is that they can blow out very quickly in response to bad news flow, so I think they’re best thought of as a lagging indicator rather than a leading one.
This thing being green by itself doesn’t tell me much.
Credit Data
9. Consumer Delinquencies
Cause for concern.
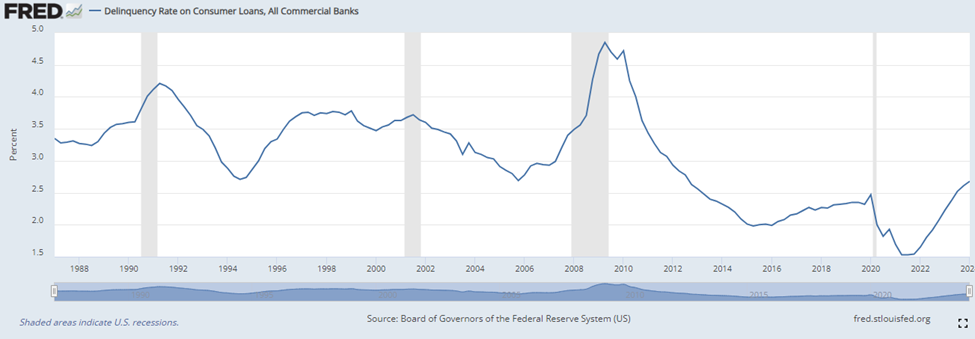
Although consumer delinquencies haven’t reached levels associated with prior recessions, the sharp rise past pre-pandemic levels can’t be ignored. Mortgage delinquencies don’t look too bad, though:
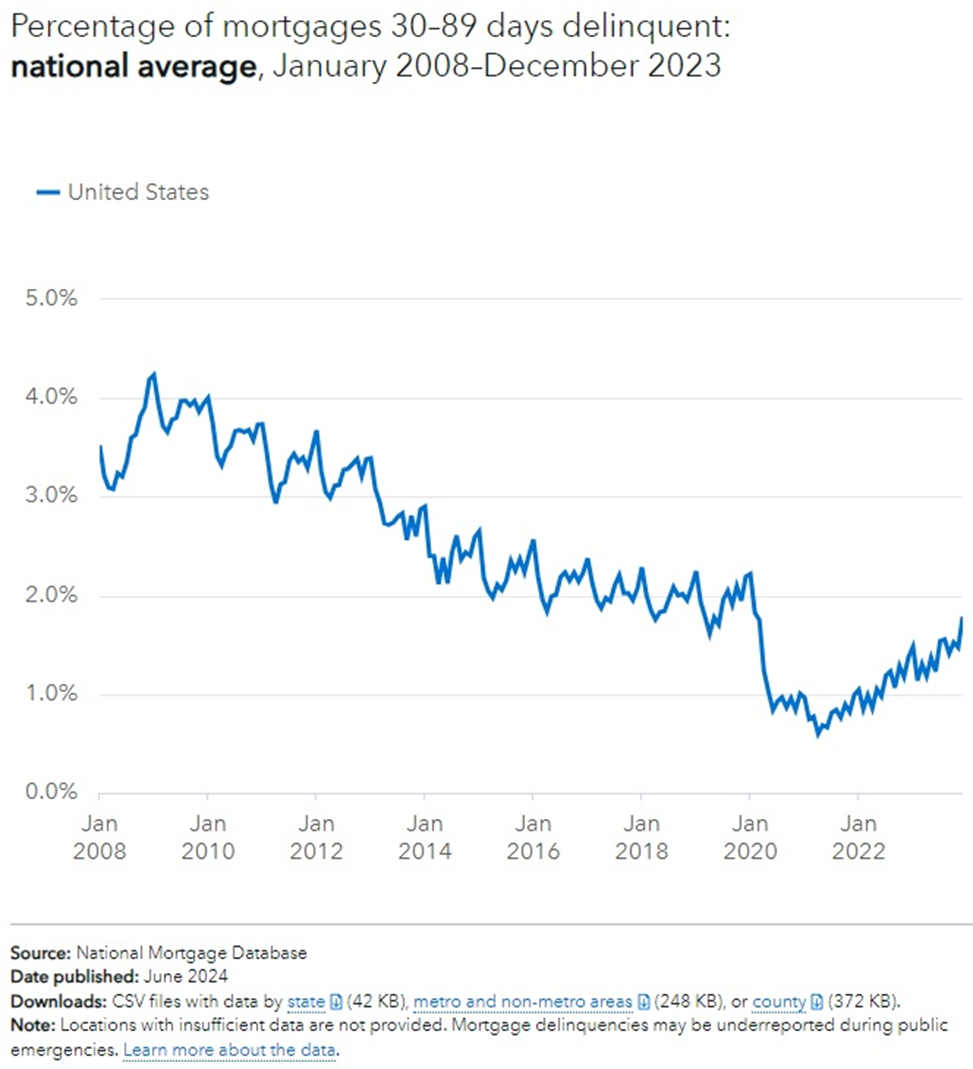
Something to keep an eye on.
10. Bankruptcies
Cause for concern.
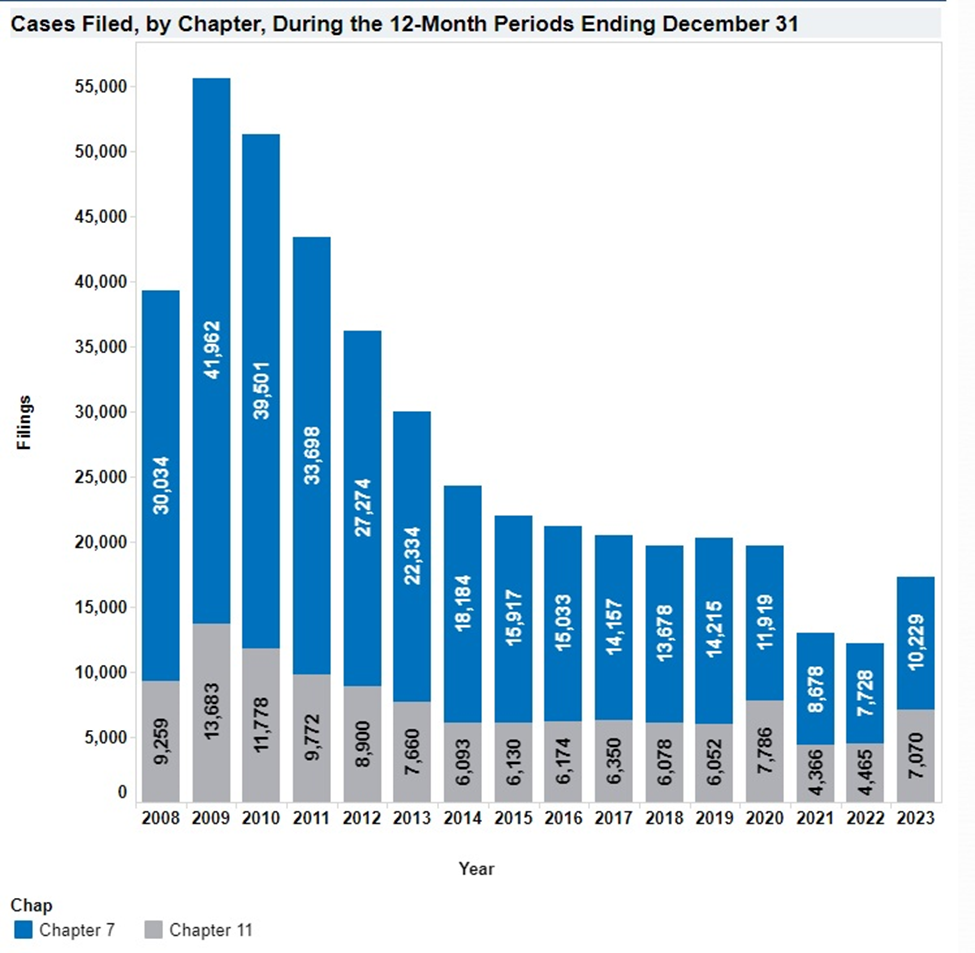
Is the uptick in bankruptcies merely a return to normal pre-pandemic levels, or does it herald something worse coming down the pipe?
If you’ve been following my blog for a while, you know that I think the “pre-pandemic normal” is not normal. I think the ~12 years of zero interest rates we had from 2009 to 2021 has led to a great deal of capital misallocation and a bunch of zombie companies. I still think that within the next two years we’ll see bankruptcy numbers higher than the 2014 levels.
Conclusion and a few thoughts on Powell
Let me start with Powell.
Reading through the press conference transcript, the feeling that I got from his comments is that the Committee is ready to turn on a dime. In terms of the dual mandate, Powell said that the Committee’s focus will be on the aspect of the dual mandate that is farther from the goal—full employment or price stability. Over the last two years, it was clear that price stability was farther away from the goal. Now, downside risks to employment are real, according to Powell, and that was before Friday’s bad jobs report.
I think the Committee is right to shift directions and look at easing policy.
Looking at the data, I see a lot of trendlines that are going in the wrong direction. Readings over the last three years were distorted because pandemic stimulus brought a lot of these indicators to far above or below their historical averages, so it’s hard to immediately tell what is an indicator of the economy slowing down and what is an indicator of pandemic distortions returning to normal. However, looking at the market indicators—stock market euphoria combined with an inverted yield curve—I can’t help but feel that something is wrong. And I return to what I said last year—when interest rates go up, things break. I’ve seen far less stuff break so far than I expected. Maybe the breakage is yet to come.